Scalable Social Network App
Implementing a scalable web service
In this project, I was motivated to capture and learn about the workflows and important details that go into designing, developing, testing, scaling, and deploying a real world scalable web application. I was fortunate to be advised by industry expert and security engineer Bryce Boe and lead engineer Nevena Golubovic in this project. Check out our github repository for more details!
I implemented a scalable web service (social network app) using Ruby on Rails and PostgreSQL DB hosted on AWS.
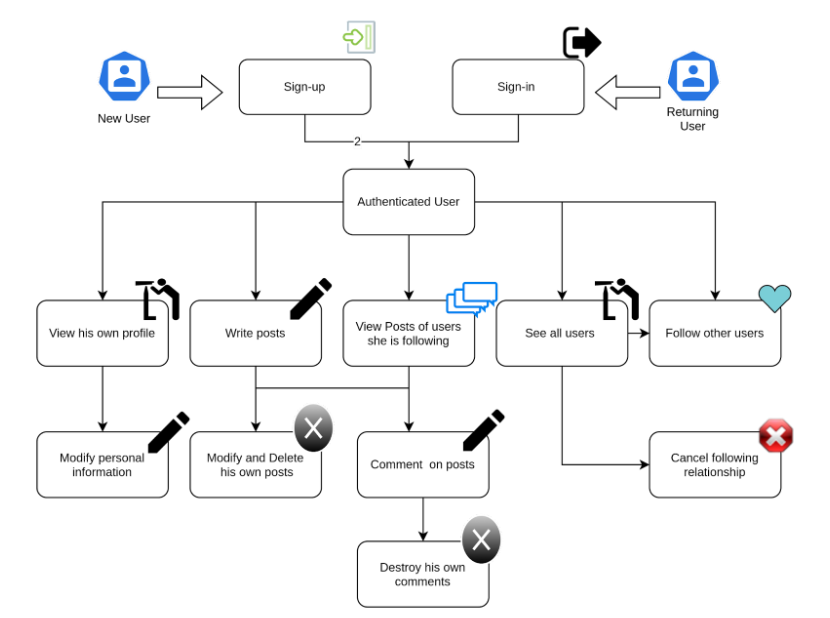
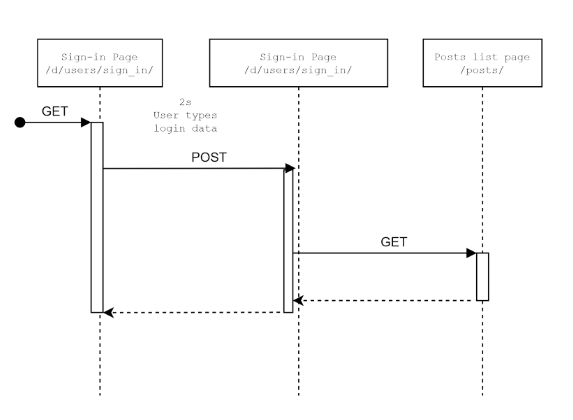
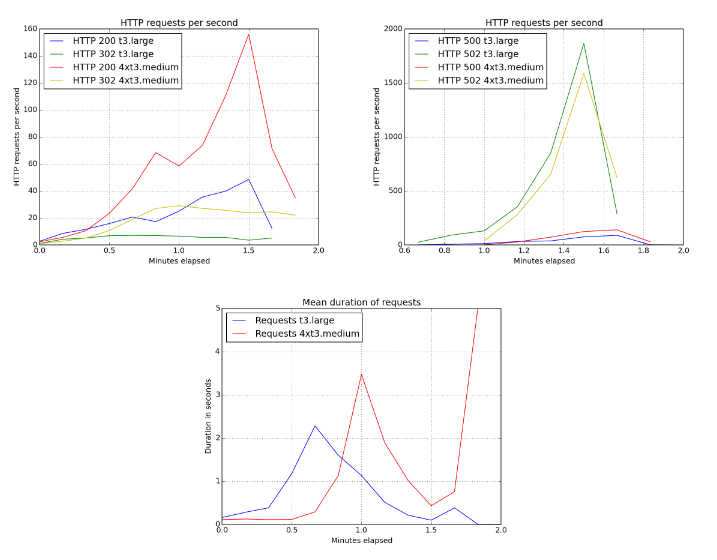
I performed load testing on different workflows using Tsung (horizontal scaling, vertical scaling, pagination, etc.) to design and develop newer versions of our application to better deal with incrementing traffic and incrementally improved our application.
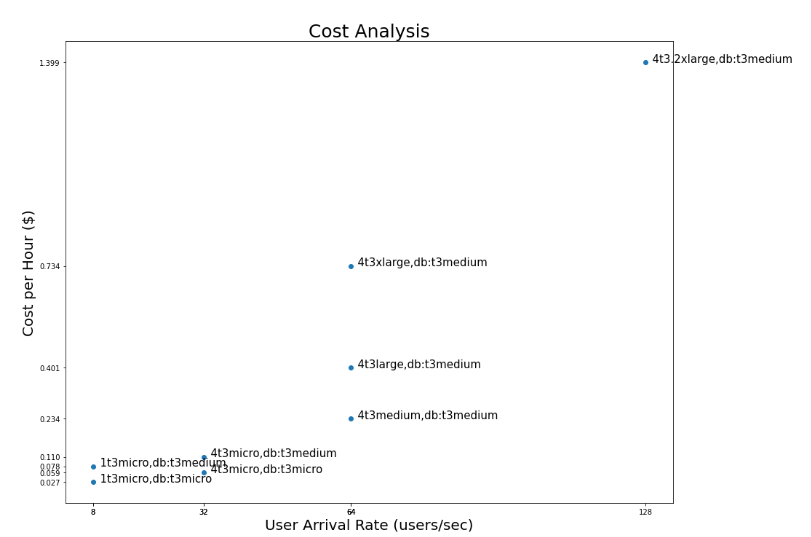
I also analyzed costs on all workflows to determine optimal hardware specification for each user arrival rate.
<!--
  See https://www.debugbear.com/blog/responsive-images#w-descriptors-and-the-sizes-attribute and
  https://developer.mozilla.org/en-US/docs/Learn/HTML/Multimedia_and_embedding/Responsive_images for info on defining 'sizes' for responsive images
-->

  <source
    class="responsive-img-srcset"

      srcset="/assets/img/app-features-480.webp 480w,/assets/img/app-features-800.webp 800w,/assets/img/app-features-1400.webp 1400w,"
      type="image/webp"


      sizes="95vw"

  >

<img
  src="/assets/img/app-features.png"

    class="img-fluid rounded z-depth-1"


    width="100%"


    height="auto"


    title="app features"


    loading="lazy"

  onerror="this.onerror=null; $('.responsive-img-srcset').remove();"
>
</picture>
</figure>
</div>
</div>
I performed load testing on different workflows using Tsung (horizontal scaling, vertical scaling, pagination, etc.) to design and develop newer versions of our application to better deal with incrementing traffic and incrementally improved our application.


I also analyzed costs on all workflows to determine optimal hardware specification for each user arrival rate.

–>